
0. Abstract
It’s a very interesting phenomenon that global transformation by a the Moon’s tide stress seems to be a trigger of occurrence for a disastrous earthquake (M>=5.5).
It is found out that some statistically considered research papers geared to past earthquakes, there is no one which show about Lunar Age or Lunar Phase Angle clearly.The one of possibility reason is tidal phase angle on the Earth depends on the lunar age. However, many people can not calculate the tidal phase angle.
This article’s objective is that many people are able to imagine at time of high potential of earthquake occurrence intuitively by using visualization of the position of the Moon and the Sun when earthquake was occurred.
1. Introduction
Schuster (1987) [1] is first article which discuss the influence of the tide from the moon. Some Studies, such as Tanaka (2012) [2] and Ide et al. (2016) [3], are studied the relationship between the earth tides and earthquakes with targeting specific seismic sources (groups). Tsuruoka and Ohtake (1995) [4] discussed the relationship with the global tides for earthquakes that occurred in the world. However, it is too difficult to calclulate tidal stress and to understand it for non-academia ordinary people. Therefore, I show some figures of relationship between earthquakes and lunar age in order to imagine the timing of earthquake occurrence.
2. Data
2.1 Data Source
I selected the "Significant Earthquakes, 1965-2016" as the earthquake catalog to visualize target which is probably presented by USGS (United States Geological Survey) on Kaggle platform.
Some earthquake catalogs (or past event lists) are opend on official sites of public organizations, such as USGS, Meteorological Institute of Japan, Disaster-Reduction Research of Japan. These catalogs are not useful because it is not simple list.
Almost earthquakes are caused by plate tectonics at each location, regional characteristics exists. This article target for wide-area seismic activity on the whole earth, regional characteristics are not considered at all. Because it makes hard to discuss the actual mechanism of earthquake occurrence, this may be cause a feeling of strangeness to researcher.
2.2 Data Overview
Let’s confirm a few head data after reading catalog.
import math
import datetime
import os, sys
import numpy as np
import pandas as pd
DATA_DIR = "/kaggle/input/earthquake-database" + os.sep

# read data file
earthquake = pd.read_csv(
      DATA_DIR+"database.csv",
      sep=",",
      parse_dates={'datetime':['Date', 'Time']},
      encoding="utf-8",
      error_bad_lines=False,
)

# treating irregular data
for idx in [3378,7512,20650]:
    earthquake.at[idx, "datetime"] = earthquake.at[idx, "datetime"].split(" ")[0]

earthquake["datetime"] = pd.to_datetime(earthquake["datetime"], utc=True)
earthquake.set_index(["datetime"], inplace=True)

earthquake.head()
| Latitude | Longitude | Type | Depth | Depth Error | Depth Seismic Stations | Magnitude | Magnitude Type | Magnitude Error | Magnitude Seismic Stations | Azimuthal Gap | Horizontal Distance | Horizontal Error | Root Mean Square | ID | Source | Location Source | Magnitude Source | Status | |
|---|---|---|---|---|---|---|---|---|---|---|---|---|---|---|---|---|---|---|---|
| datetime | |||||||||||||||||||
| 1965-01-02 13:44:18+00:00 | 19.246 | 145.616 | Earthquake | 131.6 | NaN | NaN | 6.0 | MW | NaN | NaN | NaN | NaN | NaN | NaN | ISCGEM860706 | ISCGEM | ISCGEM | ISCGEM | Automatic |
| 1965-01-04 11:29:49+00:00 | 1.863 | 127.352 | Earthquake | 80.0 | NaN | NaN | 5.8 | MW | NaN | NaN | NaN | NaN | NaN | NaN | ISCGEM860737 | ISCGEM | ISCGEM | ISCGEM | Automatic |
| 1965-01-05 18:05:58+00:00 | -20.579 | -173.972 | Earthquake | 20.0 | NaN | NaN | 6.2 | MW | NaN | NaN | NaN | NaN | NaN | NaN | ISCGEM860762 | ISCGEM | ISCGEM | ISCGEM | Automatic |
| 1965-01-08 18:49:43+00:00 | -59.076 | -23.557 | Earthquake | 15.0 | NaN | NaN | 5.8 | MW | NaN | NaN | NaN | NaN | NaN | NaN | ISCGEM860856 | ISCGEM | ISCGEM | ISCGEM | Automatic |
| 1965-01-09 13:32:50+00:00 | 11.938 | 126.427 | Earthquake | 15.0 | NaN | NaN | 5.8 | MW | NaN | NaN | NaN | NaN | NaN | NaN | ISCGEM860890 | ISCGEM | ISCGEM | ISCGEM | Automatic |
2.3 World Map
Confirming the distribution of Earthquakes:
import matplotlib.pyplot as plt
plt.style.use('dark_background')
plt.grid(False)
from mpl_toolkits.basemap import Basemap
%matplotlib inline
ti = "Map of Earthquake's epicenter duaring 1965-2016"
fig, ax = plt.subplots(figsize=(18, 18), dpi=96)
fig.patch.set_facecolor('black')
plt.rcParams["font.size"] = 24
m = Basemap(projection='robin', lat_0=0, lon_0=-170, resolution='c')
m.drawcoastlines()
#m.drawcountries()
m.fillcontinents(color='#606060', zorder = 1)
#m.bluemarble()
#m.drawmapboundary(fill_color='lightblue')

for i in range(5,10,1):
    #print(i)
    tmp = earthquake[(earthquake["Magnitude"]>=i)&(earthquake["Magnitude"]<i+1)&(earthquake["Type"]=="Earthquake")]
    x, y = m(list(tmp.Longitude), list(tmp.Latitude))
    points = m.plot(x, y, "o", label=f"Mag.: {i}.x", markersize=0.02*float(i)**3.2, alpha=0.55+0.1*float(i-5))

plt.title(f"{ti}", fontsize=22)
plt.legend(bbox_to_anchor=(1.01, 1), loc='upper left', borderaxespad=0, fontsize=18)
ax_pos = ax.get_position()
fig.text(ax_pos.x1-0.1, ax_pos.y0, "created by boomin", fontsize=16)
plt.show()

We can find the Ring of Fire on the Pacific Sea. Japan is one of the most concentlated country area of earthquake.
2.4 Distribution of the Depth
Let’s confirm the distribution of the Depth of seismic sources.
ti = "Distribution of Earthquake's Depth"
fig, ax = plt.subplots(figsize=(16, 9), dpi=96)
fig.patch.set_facecolor('black')
plt.rcParams["font.size"] = 24
for i in range(5,8,1):
    tmp = earthquake[(earthquake["Magnitude"]>=i)&(earthquake["Magnitude"]<i+1)&(earthquake["Type"]=="Earthquake")]
    plt.hist(tmp["Depth"], bins=60, density=True, histtype='step', linewidth=2.5, label=f"Mag.: {i}.x")
tmp = earthquake[(earthquake["Magnitude"]>=8)]
plt.hist(tmp["Depth"], bins=60, density=True, histtype='step', linewidth=1.5, label=f"Mag.: >8.x")
plt.legend(bbox_to_anchor=(1.02, 1), loc='upper left', borderaxespad=0, fontsize=18)
plt.xlabel("Depth, km")
plt.ylabel("Count of Earthquake \n (Normarized at Total surface=1)")
plt.title(f"{ti}")
ax_pos = ax.get_position()
fig.text(ax_pos.x1+0.01, ax_pos.y0, "created by boomin", fontsize=16)
plt.show()

We notice following facts:
- concentlating in shallower area than 100km
- there is also a concentlated areas between 550km and 650km
We are not able to confirm from this figure, epicenters of the earthquakes which are occureed below 550km depth may be locate at center area of continental, not at plate boundary.
The depth of seismic source due to tidal stress or ocean tide is approximately 70-80 km, considering the occuerrence mechanism.
From now on, we use the data shallower than 80km to visualize.
earthquake = earthquake[earthquake["Depth"]<80]
earthquake = earthquake[earthquake["Type"]=="Earthquake"]
2.5 Distribution of Latitude
Showing the distribution of latitude of epicenter because tidal stress depends on the latitude of the earth.
plt.clf()
ti = "Distribution of Earthquake's Latitude with Magnitude"
fig, ax = plt.subplots(figsize=(16, 9), dpi=96)
fig.patch.set_facecolor('black')
plt.rcParams["font.size"] = 24
#
for i in range(5,8,1):
    tmp = earthquake[(earthquake["Magnitude"]>=i)&(earthquake["Magnitude"]<i+1)&(earthquake["Type"]=="Earthquake")]
    plt.hist(tmp["Latitude"], bins=60, density=True, histtype='step', linewidth=1.5, label=f"Mag.: {i}.x")
tmp = earthquake[(earthquake["Magnitude"]>=8)]
plt.hist(tmp["Latitude"], bins=60, density=True, histtype='step', linewidth=1.5, label=f"Mag.: >8.x")
#
plt.legend(bbox_to_anchor=(1.02, 1), loc='upper left', borderaxespad=0, fontsize=18)
plt.xlabel("Latitude, deg")
plt.ylabel("Count of Earthquake \n (Normarized at Total surface=1)")
plt.title(f"{ti}")
ax_pos = ax.get_position()
fig.text(ax_pos.x1+0.01, ax_pos.y0, "created by boomin", fontsize=16)
plt.show()

There are some peaks, such as at -10 deg or 50 deg, however distribution of latitude depends on the location of plate boundary. This figure do not show the correlation between the tidal stress from the Moon and occuracy of earthquake. This is described later in section 4.2.
3. Orbit calculation of the Moon and the Sun from the Earth
The tidal stress at the superficial area of the Earth become large at the following:
- when the Moon come close to the Earth ** tidal stress is inversely proportional to the cube of distance ** influence from the Sun is aproximatry 45% of the Moon because the distanse is effective
- when New Moon or Full Moon ** the face in the same direction of gravitation from the Moon and the Sun
- when high tide or low tide ** change in sea level affects oceanic plate as load
Therefore, I calculate following values at each time of occurrence of earthquake:
- distance between the Moon and the Earth
- phase angle between the Moon and the Sun at epicenter
- Altitude and Azimuth Direction of the Moon at each epicenter
3.1 Library
Astoropy is used for calculation of the Solar System object’s position.
3.2 Ephemeris for Astronomical position calculation
The ephemeris data is neccesery to calculate the object’s position. The DE432s, the latest data published by JPL, is applied for our calculation because DE432s is stored in a smaller, ~10 MB, file than DE432. If you would like to get more precise positions, or longer term over 1950 to 2050, you should to select DE432 or other data. If you would like to get more precise positions, or longer term over 1950 to 2050, you should to select DE430.
To retrieve JPL ephemeris of Solar System objects, we need to install following package:
# install ephemeris provided by NASA JPL
!pip install jplephem
3.3 Obtaining of Phase Angle between the Sun and the Moon
We need to determine lunar age in order to obtain the day of Full Moon and New Moon because tidal force become the strongest at Full Moon or New Moon. When the Moon is new, the direction from the Earth to the Moon coincides with to the Sun, and each gravity force vectors faces in the same direction. When the Moon is full, both the directions and gravity force vectors are in an opposite way.

Thee angle between the Moon and the Sun is defined as Phase Angle as following figure.

from numpy import linalg as LA

from astropy.coordinates import EarthLocation, get_body, AltAz, Longitude, Latitude, Angle
from astropy.time import Time, TimezoneInfo
from astropy import units as u
from astropy.coordinates import solar_system_ephemeris
solar_system_ephemeris.set('de432s')

# epcenter of each earthquake
pos = EarthLocation(Longitude(earthquake["Longitude"], unit="deg"), Latitude(earthquake["Latitude"], unit="deg"))

# time list of occerrd earthquake
dts = Time(earthquake.index, format="datetime64")
# position of the Moon and transforming from equatorial coordinate system to horizontal coordinate system
Mpos = get_body("moon", dts).transform_to(AltAz(location=pos))
# position of the Sun and transforming from equatorial coordinate system to horizontal coordinate system
Spos = get_body("sun", dts).transform_to(AltAz(location=pos))
# phase angle between the Sun and the Moon (rad)
SM_angle = Mpos.position_angle(Spos)
# phase angle from 0 (New Moon) to 180 (Full Moon) in degree
earthquake["p_angle"] = [ deg if deg<180 else 360-deg for deg in SM_angle.degree ]

earthquake["moon_dist"] = Mpos.distance.value/3.8e8
earthquake["sun_dist"] = Spos.distance.value/1.5e11
earthquake["moon_az"] = Mpos.az.degree
earthquake["moon_alt"] = Mpos.alt.degree

earthquake.head(5)
| datetime | Latitude | Longitude | Type | Depth | Depth Error | Depth Seismic Stations | Magnitude | Magnitude Type | Magnitude Error | Magnitude Seismic Stations | … | ID | Source | Location Source | Magnitude Source | Status | p_angle | moon_dist | sun_dist | moon_az | moon_alt |
|---|---|---|---|---|---|---|---|---|---|---|---|---|---|---|---|---|---|---|---|---|---|
| 1965-01-05 18:05:58+00:00 | -20.579 | -173.972 | Earthquake | 20.0 | NaN | NaN | 6.2 | MW | NaN | NaN | … | ISCGEM860762 | ISCGEM | ISCGEM | ISCGEM | Automatic | 18.590441 | 1.066420 | 0.980692 | 119.547153 | -17.573353 |
| 1965-01-08 18:49:43+00:00 | -59.076 | -23.557 | Earthquake | 15.0 | NaN | NaN | 5.8 | MW | NaN | NaN | … | ISCGEM860856 | ISCGEM | ISCGEM | ISCGEM | Automatic | 75.604507 | 1.025486 | 0.980737 | 346.380090 | 36.903505 |
| 1965-01-09 13:32:50+00:00 | 11.938 | 126.427 | Earthquake | 15.0 | NaN | NaN | 5.8 | MW | NaN | NaN | … | ISCGEM860890 | ISCGEM | ISCGEM | ISCGEM | Automatic | 171.342678 | 1.021663 | 0.980812 | 263.044383 | 14.630800 |
| 1965-01-10 13:36:32+00:00 | -13.405 | 166.629 | Earthquake | 35.0 | NaN | NaN | 6.7 | MW | NaN | NaN | … | ISCGEM860922 | ISCGEM | ISCGEM | ISCGEM | Automatic | 144.511160 | 1.016273 | 0.980841 | 268.777926 | -14.698194 |
| 1965-01-12 13:32:25+00:00 | 27.357 | 87.867 | Earthquake | 20.0 | NaN | NaN | 5.9 | MW | NaN | NaN | … | ISCGEM861007 | ISCGEM | ISCGEM | ISCGEM | Automatic | 111.764401 | 0.965569 | 0.980901 | 183.442567 | 75.041740 |
Tidal force is maximized at the phase angle is 0 or 180 deg, however, the influence from the moon and the Sun on the Earth’s surface layer cannot be ignored due to the movement of the ocean, and the Earth’s behavior as elastic body. It means that tidal effect delays about 0 – 8 hours from tidal force change.
4. Data Visualization
4.1 Time Series of Earthquakes with its Magnitude
plt.clf()
ti = "Earthquakes with Phase Angle"
fig, ax = plt.subplots(figsize=(18, 12), dpi=96)
plt.rcParams["font.size"] = 24
fig.patch.set_facecolor('black')
for i in range(5,10,1):
    tmp = earthquake[(earthquake["Magnitude"]>=i)&(earthquake["Magnitude"]<i+1)]
    plt.scatter(tmp.index, tmp["p_angle"], label=f"Mag.: {i}.x", s=0.02*float(i)**4.5, alpha=0.2+0.2*float(i-5))
plt.xlabel("Occuerd Year")
plt.ylabel("Phase Angle (0:New Moon, 180:Full Moon), deg")
plt.legend(bbox_to_anchor=(1.02, 1), loc='upper left', borderaxespad=0, fontsize=18)
plt.title(f"{ti}")
ax_pos = ax.get_position()
fig.text(ax_pos.x1+0.01, ax_pos.y0, "created by boomin", fontsize=16)
plt.grid(False)
plt.show()

Data points are dispersed around 90 degrees in Phase Angle, Let’s confirm the distribution by drawing histogram.

This figure indicates that large (especially M>8) earthquakes tend to increase around the New Moon and the Full Moon.
4.2 Relationship between the epicenter and Phase Angle
A simple distribution figure has already been shown in section 2.1. Here we visualize a little more detail.

This distribution appears to be biased. The earthquakes around terrestrial equator occur when phase angle is about 0 deg or 180 deg, which means the Moon is full or new.

At least, this figure indicates followings:
- Phase angle between the Sun and the Moon impacts each position (latitude) differently
- There are seismic sources which easily are influenced by the phase angle
4.3 Phase Angle and the Distance
Relationship between Magnitude and Distances of the Sun and the Moon.

It seems that data points are concentrated about 0.97 and 1.05 in distance. It’s checked distance dependency respectively about Phase Angle and Magnitude.


However, this may be misinformation because this distribution is almost the same as the one of the Earth-Month distance in the lunar orbit.
Upper fugure shows that there is no dependency of the distance to the Moon. Lunar tidal stress affects by gain of amplitude of tidal stress, not magnitude of force (Tsuruoka and Ohtake (1995)[4], Elizabeth et al. (2014)[5]). It is safe to say that there facts are consistant.
4.4 Distribution of Moon’s azimuth
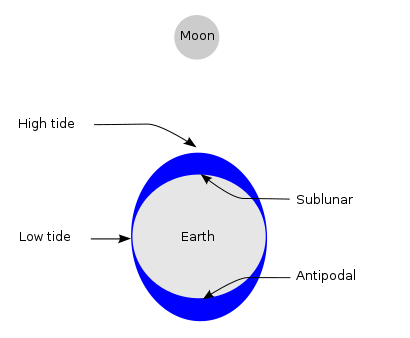
The lunar gravity differential field at the Earth’s surface is known as the tide-generating force. This is the primary mechanism that drives tidal action and explains two equipotential tidal bulges, accounting for two daily high waters.
If it is strongly affected by tidal stress from the Moon, it is expected that many earthquakes will occur at the time when the Moon goes south or after 12 hours (opposite) from it. However, the time taken for the wave to travel around the ocean also means that there is a delay between the phases of the Moon and their effect on the tide.
Distribution of azimuth of the Moon when earthquake is occurred is shown following.

There are two peaks at 90deg (East:moonrise) and 270deg (West:moonset), and it does not seem that there is no difference between Magnitudes.
Tidal stress itself has a local maximum at culmination of the Moon (azimuth:180deg), the change rate per unit time (speed of change) is local minimal at the time. The change rate is delayed 90deg (about 6 hours: this means that if you differentiate sin, it becomes cos). In addition, depending on the location, ocean sea level changes due to tides are delayed by approximately 0-8 hours.
These phenomena are consistent with upper figures. However, it is difficult because the azimuth of the Moon is depended on Latitude. Therefore, distribution of azimuth with some phase angles are shown as follow:

When azimuths are 90 deg and 270 deg, it means the Full Moon and a New Moon, the earthquake occur more frequently. This means that you should pay attention at moonrise and moonset.
4.5 Distribution of Moon’s Altitude
Let’s confirm the relationship between Lunar Altitude and Phase Angle.

The culmination altitude (the highest altitude) of the Moon is depend on observer’s latitude. This means that vertical axis of this figure makes the sense that the relative value is more important.
It can be confirmed that the distribution with altitude around 0 degrees, and the phase angle close to 0 degrees or 180 degrees in the above figure is larger than the distribution of the phase angle near 90 degrees. This is consistent with the discussed about azimuth distribution in section 4.4.
It’s to be noted that a fault orientation is one of key point to consider, I should also focus on each region under ordinary circumstances.
4.6 Seasonal Trend
Earthquake occurrence frequency of each month are shown as following. Many earthquakes in March 2011 were occurred by Tohoku‐Oki earthquake (Mw 9.1) in Japan, I divide the dataset 2011 and except 2011.

      except 2011      2011
----------------------------
Jan      0.931141  0.903226
Feb      0.911911  1.032258
Mar      0.948511  7.161290
Apr      0.967742  1.387097
May      0.950372  1.258065
Jun      0.892060  1.161290
Jul      0.905087  1.677419
Aug      0.972084  1.225806
Sep      0.962779  1.000000
Oct      0.936725  0.967742
Nov      0.965881  0.935484
Dec      0.991315  0.709677
----------------------------
MEAN     0.944634  1.618280
STD      0.030059  1.763944
The mean and standard deviation of daily occurrence of earthquake of dataset except 2011 is calculated as 1.164 and 0.040, respectively. It seems to conclude that there is no seasonal variation since the 2σ range is not exceeded for all months.
It is also important to remember that some article point out regional characteristic features (Heki, 2003)[6]). This indicates that a specific seismic source or fault may have strongly seasonal variation.
5. Summary
I investigated and visualized the relationship between earthquakes (magnitude >5.5) and the position of both the Moon and the Sun. These results are following:
- The Moon affects on earthquakes on the Earth strongly like Moonquakes are influenced by the Earth’s tidal stress.
- The earthquake occurrence increases or decreases according to the phase angle of the Moon and the Sun (lunar age), rather than the distance to the Moon or the Sun.
- Earthquakes that are occurred near the equator are more strongly related to phase angle than polar regions.
- Annual cycle (seasonal variation) could not be confirmed.
In addition, following are indicated:
- Date of earthquake (especially magnitude is higher than 8.0) occurrence tend to full moon or new moon.
- Time of earthquake occurrence tend to along about moon rise or moon set (when full moon or new moon, especially)
This article go no further than visualizing and mention of trend only.
6. Future Work
I would like to try a targeted visualization on selected regional area.
Reference
[1] Schuster, A., On lunar and solar periodicities of earthquakes, Proc. R. Soc. Lond., Vol.61, pp. 455–465 (1897).
[2] S. Tanaka, Tidal triggering of earthquakes prior to the 2011 Tohoku‐Oki earthquake (Mw 9.1), Geophys. Res. Lett., 39, 2012
[3] S. Ide, S. Yabe & Y. Tanaka, Earthquake potential revealed by tidal influence on earthquake size–frequency statistics, Nature Geoscience vol. 9, pp. 834–837, 2016
[4] H. Tsuruoka, M. Ohtake, H. Sato,, Statistical test of the tidal triggering of earthquakes: contribution of the ocean tide loading effect, Geophysical Journal International, vol. 122, Issue 1, pp.183–194, 1995.
[5] ELIZABETH S. COCHRAN, JOHN E. VIDALE, S. TANAKA, Earth Tides Can Trigger Shallow Thrust Fault Earthquakes, Science, Vol. 306, Issue 5699, pp. 1164-1166, 2004
[6] K. Heki, Snow load and seasonal variation of earthquake occurrence in Japan, Earth and Planetary Science Letters, Vol. 207, Issues 1–4, Pages 159-164, 2003